View WAAP statistics in Grafana
WAAP request and traffic totals for the account can be shown as Grafana time-series panels. The Grafana plugin adds the CDB Platform-EN data source.
The previous WAAP-only plugin (Waap) is deprecated. Migrate existing dashboards to CDB Platform-EN.
Configure a dashboard
The panel uses the connected CDB Platform-EN data source.
- In the top bar, click +, then New dashboard.
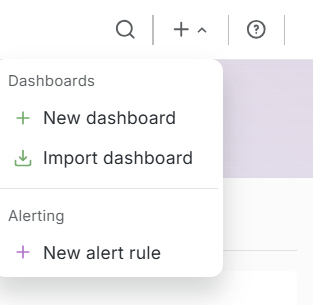
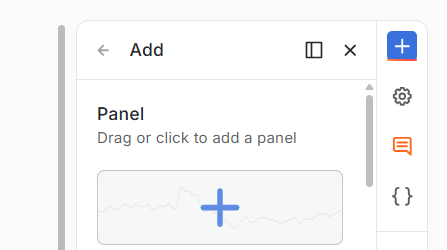
- The Add drawer opens on the right. Click Panel.
-
Click Edit visualization.
-
Under Data source, select CDB Platform-EN.
-
Under Edge Network, set Service to WAAP.
-
Under Query Props, set Metric and Granularity. Legend Format is optional.
-
Click Save. In Save dashboard, enter a title and click Save.
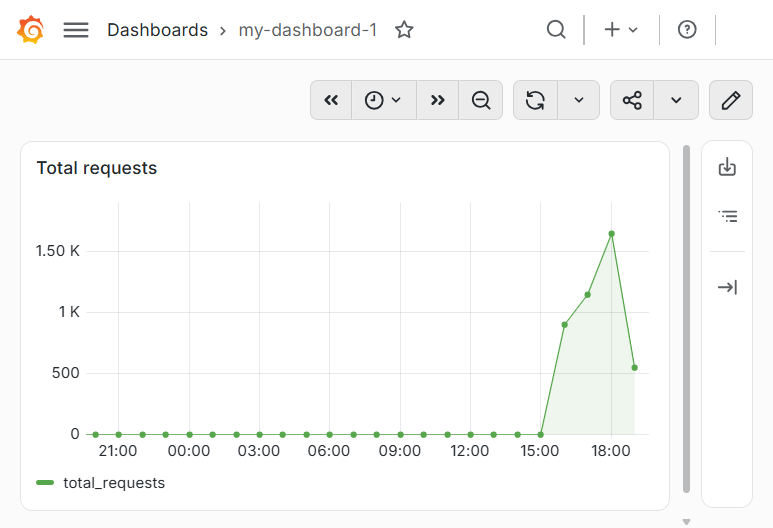
The saved dashboard shows the title and the panel.
Query fields
A WAAP query returns one series for the account. The editor has no group-by control and no domain filter. An alert rule on that series changes state when requests or traffic cross a threshold.
| Metric | Description |
|---|---|
total_requests | Number of HTTP requests processed by WAAP |
total_bytes | Traffic volume, shown in kilobytes |
Granularity: 1h or 1d. The series has one point per hour or per day.
Legend Format: optional series name. The default legend is the metric name.
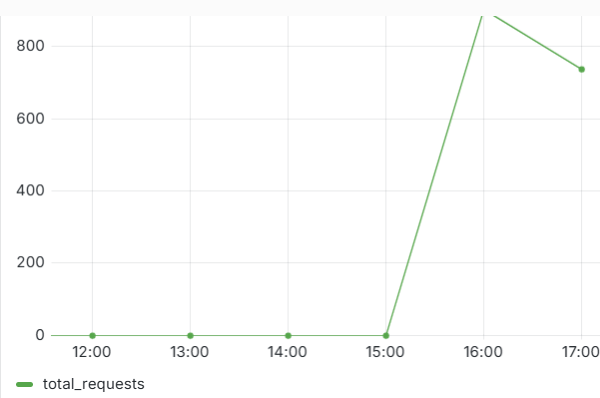
total_requests with granularity 1h: