View CDN statistics in Grafana
CDN delivery traffic, cache efficiency, and request counts can be shown as Grafana time-series panels. The Grafana plugin adds the CDB Platform-EN data source.
The previous CDN-only plugin (cdn-stats) is deprecated. Migrate existing dashboards to CDB Platform-EN.
Configure a dashboard
The panel uses the connected CDB Platform-EN data source.
- In the top bar, click +, then New dashboard.
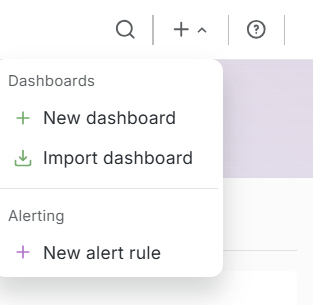
- The Add drawer opens on the right. Click Panel.

-
Click Edit visualization.
-
Under Data source, select CDB Platform-EN.
-
Under Edge Network, set Service to CDN.
-
Under Query Props, set Metric, Granularity, and Group By. Filters under Filters (comma separated) are optional.
-
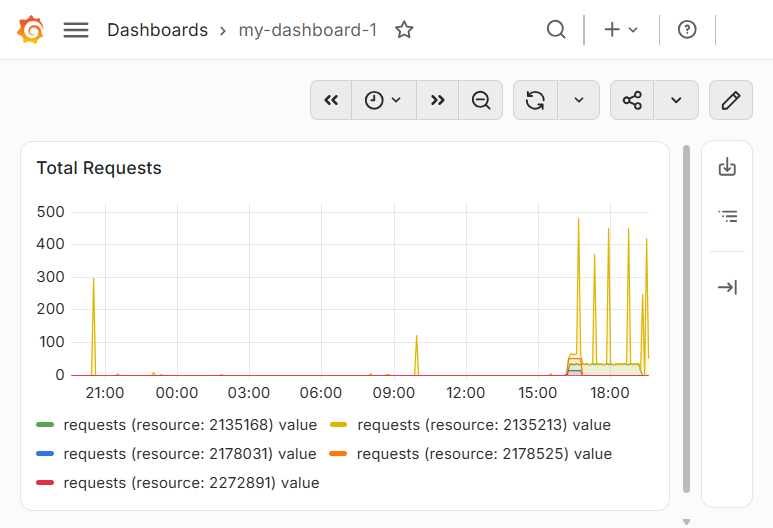
Click Save. In Save dashboard, enter a title and click Save.
The saved dashboard shows the title and the panel.
Query fields
CDN queries cover delivery traffic, cache efficiency, and request or response trends. The metric values match the CDN statistics API. An alert rule on one of these queries changes state when a value crosses a threshold.
Metrics
| Menu label | Metric | Description |
|---|---|---|
| Bandwidth | bandwidth | Maximum transfer rate during the selected time, in bytes per second |
| Total Traffic | total_bytes | Total traffic volume: origin to CDN or Shielding, Shielding to CDN, and CDN to users |
| Origin Traffic | upstream_bytes | Origin traffic: origin to CDN or origin to Shielding |
| Edges Traffic | sent_bytes | Edges traffic: Shielding to CDN plus CDN to users |
| Shield Traffic | shield_bytes | Traffic from Shielding to CDN |
| Total Requests | requests | Number of requests to the CDN |
| 2xx Responses | responses_2xx | Response count for the 2xx status class |
| 3xx Responses | responses_3xx | Response count for the 3xx status class |
| 4xx Responses | responses_4xx | Response count for the 4xx status class |
| 5xx Responses | responses_5xx | Response count for the 5xx status class |
| Image optimization | image_processed | Number of processed images |
| Cache Hit Ratio | cache_hit_requests_ratio | Share of responses served from cache |
| Byte Cache Hit Ratio | cache_hit_traffic_ratio | Share of cached traffic: 1 - (origin or Shielding traffic / CDN-to-user traffic) |
| Shield Traffic Ratio | shield_traffic_ratio | Shielding efficiency: (Shielding-to-CDN traffic - origin-to-Shielding traffic) / Shielding-to-CDN traffic |
Granularity: 5m, 15m, 1h, or 1d.
Group By: Resource, Client, Vhost (custom domain), Region, Country, or Datacenter. More than one value can be selected. The query sends resource, client, vhost, region, country, or dc.
Filters (comma separated): optional Vhosts, Resources, Clients, Regions, and Countries fields narrow the series. Separate several values with commas.
Legend Format: the default legend includes the metric name and the group-by values. A custom template uses placeholders in double curly braces that match the grouping: Traffic ({{resource}}).
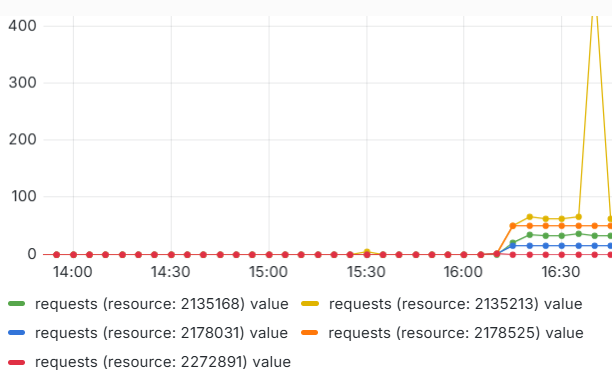
Total Requests, granularity 5m, and Group By set to Resource produce one series per CDN resource:
Dashboard variables
Dashboard variables can drive CDN filters so the same panel switches between resources, clients, or other dimensions without editing the query.
-
On the dashboard, click Add variable, then Query.
-
Set Name to the name used in the filter.
resourcematches the Resources filter. -
Under Query options, click Open variable editor. Select CDB Platform-EN, then set Values for to resourceID, vhost, client, country, or region.
-
Sort, Multi-value, and Include All value are optional.
-
Click Apply. In the matching CDN filter, enter the variable with a
$prefix.$resourcegoes in Resources. -
Save the dashboard.